Housing Market Forecasts 2019-2022
The annual QBE Australian Housing Outlook for 2019-2022 has just been released and have shown some very interesting statistical data that should enable us to look at and invest with confidence in the coming year.
This really is one of the best and most detailed reports I’ve seen with many great statistics and data for each Australian state. I’ve taken the start of the report here to give each reader a snapshot but attach the full report below for those that wish to read and look into every state in a lot more detail.

It’s always interesting to look at statistical evidence and data just to see where our leading economists and experts see our current markets and also the future. So a lot of the information that follows is their analysis and commentary around how Australia looks today and “may” look in 2022. Again, remember, as with any forecasts, it is just people’s opinion, formed with data, on where we may be. No one has a crystal ball and no one definitely knows but this is some food for thoughts with comments on each of the major markets.
And, where in the space of 2 year’s FOMO (Fear OF Missing Out) has quickly been replaced by FOBE (Fear Of Buying Early) and now, it seems, with a distinct undersupply of stock that we are re-entering the FOMO stage fuelled by lower interest rates and the certainty after the May Federal Election.
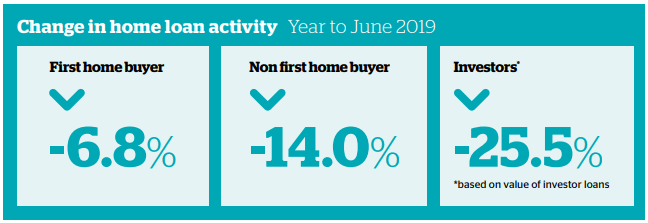
First home buyers, accounting for almost 20% of mortgage lending, are continuing to lead the charge to buy residential property as more onerous lending conditions forced many potential investors out. More than 110,000 first-time home buyers entered the market last year.

Although tighter lending standards, declining property prices and uncertainty related to the economy have deterred some, we still expect a similar number of first home buyers to be getting the keys to their very own property this year. I’m pleased to welcome you to the 18th edition of the QBE Australian Housing Outlook, authored by our partners at BIS Oxford Economics. You’ll find the latest property market forecasts and analysis, which we hope will give you some fresh perspectives as the market continues to evolve. It’s certainly been an interesting year for Australian property. Regulatory intervention in financial markets has had a profound impact on the residential property market. While record low interest rates and low unemployment would typically have continued to fuel property prices, the limited availability of credit has more than offset demand resulting in significant property price declines across many of our capital cities.
The future looks a lot brighter for our capital cities. In our largest markets of Sydney and Melbourne we expect property prices to stabilise as owner occupiers are enticed back. Strong population growth continues to underpin demand and the residential property market endures as one of the core contributors to our domestic economy.
This year’s report shines a spotlight on the current composition of residential property construction in the Australian market. In the feature “Highdensity missing the mark?” we dissect a vital residential property challenge currently facing many of our capital cities. With the Australian dream of home ownership as strong as it has ever been, the residential property market must continue to evolve.
The State of Play
House prices across all capital cities are expected to stabilise in 2019/20 after experiencing slowing growth or declines in the past two years.
The combination of an easing of lending serviceability buffers and lower interest rates is expected to assist borrowers.
Strong population growth and a sharp downturn in new dwelling completions should result in the dwelling balance across most markets tightening from 2020/21. This will provide some positive impetus to prices.
New dwelling completions have averaged a record 209,000 per annum in the five years to 2018/19 with each of these years being higher than any year prior. The increased supply has helped alleviate some of the demand pressures coming from strong population growth across most capital city markets.
Property prices are expected to continue to be supported by further employment growth and a low unemployment rate, as well as cuts to interest rates in 2019. This is expected to support borrowers and put a floor on prices before assisting price growth as new supply starts to fall away.
Demand and Supply
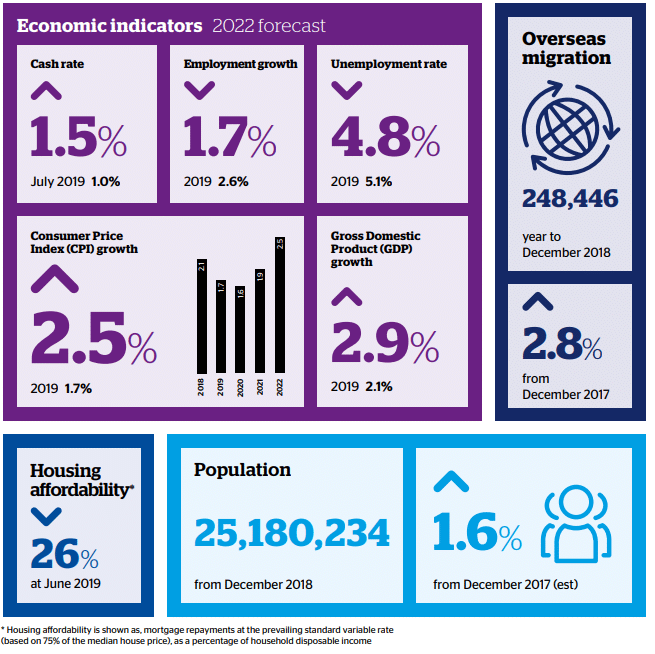
Strong population growth will be key to the market navigating the downturn in property prices. Net overseas migration is forecast to average a net inflow of 243,000 per annum in the three years to 2021/22 and this is expected to translate to underlying demand for an additional 204,000 dwellings per annum.

At the same time, new dwelling building approvals fell by 19% in 2018/19 and dwelling completions are subsequently forecast to fall to 163,500 dwellings by 2020/21, which is well below underlying demand. This could mean some oversupplied markets will tip back into undersupply by 2021/22 creating the potential for a recovery in prices.
However, the pace of recovery may be limited. While the interest rate serviceability threshold for most borrowers has been reduced, lenders are expected to maintain their more conservative approach towards assessing borrower income and expenses.
There is also the possibility of interest rate rises by 2021/22 as the economy begins to gather momentum.
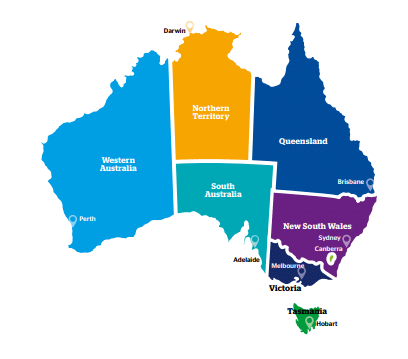
City outlook
The strongest outlook for property prices is forecast for Brisbane, where a decade of modest price increases has left the market relatively affordable. An oversupply in the market is negatively impacting prices, but it is predicted that a combination of rising population growth and rapidly falling supply will see this situation turn. With the Queensland economy also forecast to strengthen, residential price growth is forecast to steadily accelerate through to 2021/22.
In both Canberra and Adelaide, with conditions predicted to remain steady, the recent moderate price growth is forecast to continue, although the Canberra median house price is expected to be influenced in the short term by the timing of the introduction of the first home buyer stamp duty exemption from 1 July 2019.

The worst appears to have passed for the Sydney and Melbourne markets, but upside over the next three years remains limited. Despite some easing in the assessment of mortgage serviceability by lenders, more rigorous assessments of income and expenses in loan applications are predicted to continue to impact growth in credit and therefore the rate of property price growth.
After strong rises over the past four years, price growth in Hobart is now slowing due to affordability constraints. The Perth and Darwin residential markets are forecast to remain weak in the short term, but by 2021/22, an upturn in property prices is projected to emerge as their dwelling oversupplies are absorbed and the improved affordability provides a trigger for price growth as economic conditions begin to strengthen.
High Density Missing the Mark?
The share of new medium and high-density dwellings (units) has increased across Australia’s capital cities to meet the demand for affordable homes. But is this a positive outcome for the residential property market and housing affordability?
Units and particularly new apartment developments are largely catered for and built with investors in mind. Developers are reliant on pre-sales (who are usually investors) to obtain the finance to commence construction.
In contrast, owner occupiers, who actually account for the majority of buyers, have typically favoured properties that they can readily move into. However, units have a significantly longer gestation period than houses.
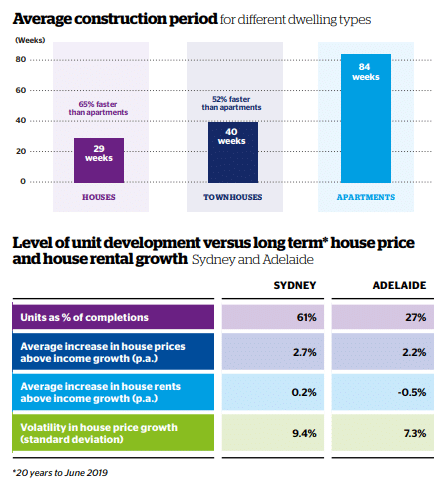
The Australian Bureau of Statistics reports that an apartment building on average takes 84 weeks to build, which is almost three times longer than a house. A typical high-rise apartment building can take well over two years to complete, with the total development period being even longer when the pre-selling period is accounted for.
Consequently, units are less able than houses to meet rapid changes in demand, particularly owner occupier demand, due to the longer gap between the rise in demand and the new supply coming onto the market. The lag can drive up prices as an undersupply will persist longer. This price volatility also attracts speculative investments for capital gains rather than for long term occupation of housing.
In turn, this speculative demand fuels new supply to hit the market simultaneously as the market peaks, ultimately resulting in excess stock and downward price pressures.
Evidence of the price volatility created by an increased reliance on units can be seen in a comparison of the Sydney and Adelaide residential property markets performance over the past 20 years. Average house rent and price growth (relative to incomes) in Sydney, where over 60% of new supply comprises of units, has been greater than in Adelaide, where units have accounted for only 27% of new supply.

Volatility in Sydney has also been higher, with price growth varying 9.4% around the average compared to 7.3% for Adelaide. Consequently, the trend of increasing medium and high-density development is at odds with providing more affordable housing for owner occupiers.
Unless more houses are provided to the market, or timely delivery models for medium and high-density dwellings are developed, then the mismatch in the timing of demand versus supply is expected to persist. Continued price volatility could become even more evident in the next few years as more onerous lending conditions have forced many potential investors out of the market.
The outcome will likely be a delay in the supply of new units, potentially causing accelerated price growth and reduced housing affordability.
I hope you’ve enjoyed the snapshot of this report, the data and statistics as well as future forecasts.
For more information you can click below for the full report and state by state breakdown.
Andrew Mirams is the Founder and Managing Director of Intuitive Finance, a highly respected and multi-award winning Mortgage Brokerage dealing with clients all over Australia and around the world. Andrew has over 30 year’s experience in the finance industry and has assisted clients to secure over $2 Billion in mortgage lending over his time. Intuitive Finance deals with all aspects of lending from helping first homebuyers, someone wanting to upgrade their home or starting out and experienced investors looking to secure that next investment property, we can assist with all those requirements. We also specialise in working with self-employed clients and getting them the best outcomes, along with Commercial and Asset finance solutions. Intuitive Finance is highly regarded in the industry and has been recognised as a national winner of the MFAA customer service award and also one of the finance industry’s top mortgage employers. Our brokers also feature regularly in the Top 100 mortgage brokers list in Australia.