Australian housing market bubble: myth or reality?
It’s 18 months now since property markets, particularly in Sydney and Melbourne, saw the beginning of a softening in median prices.
Or, what some pundits will have you believe, was a bursting of Australia’s housing bubble. The popping of a balloon that had been filled far too much for too long, sending prices tumbling.
Those people are the same ones who, for a few months leading up to the start of the decline in late 2017, predicted a collapse of real estate prices.
What really happened? Was that a bubble and, if so, how loud was the pop? Let’s have a look.
What’s happening at the moment?
The latest median house price data for Australia’s two biggest property markets shows that the rate of decline has not just slowed but seems to have stopped.
In Sydney and Melbourne, CoreLogic reports prices ticked upwards in June – modestly, by 0.1 and 0.2 per cent respectively, but, still, up is up.

It seems like the storm is passing and a recovery could be on the horizon, which is good news for investors.
We also know that rents in Melbourne have just risen for the first time in four years, owing to a smaller number of buyers recently and a drop-off in construction activity.
Economists are forecasting similar movements in rental values in Sydney.
The first week of July saw the auction clearance rate for the capital cities combined hit above 60 per cent, which is a good result.
Currently, the median price for all dwellings – houses and units – in Sydney is $777,693, while in Melbourne it’s $619,383.
So, was that a bubble?
Well, the problem with bubbles is that no one can quite agree on what a bubble constitutes.

Economists and pundits do agree that it’s when a market inflates in value relative to some other measure… but what? Historical prices? If so, from when? A year ago? Five years ago? A decade ago?
And, then, there are a whole bunch of people in finance and property circles who don’t believe bubbles exist.
They believe instead that markets go up and, when the rate of increase is too much, they correct, settle and then begin a cycle of growth again. I’m inclined to subscribe to that school of thought.
And here’s why. This chart plots the national median house and unit price over a 20-year period from early 1993 to early 2018.
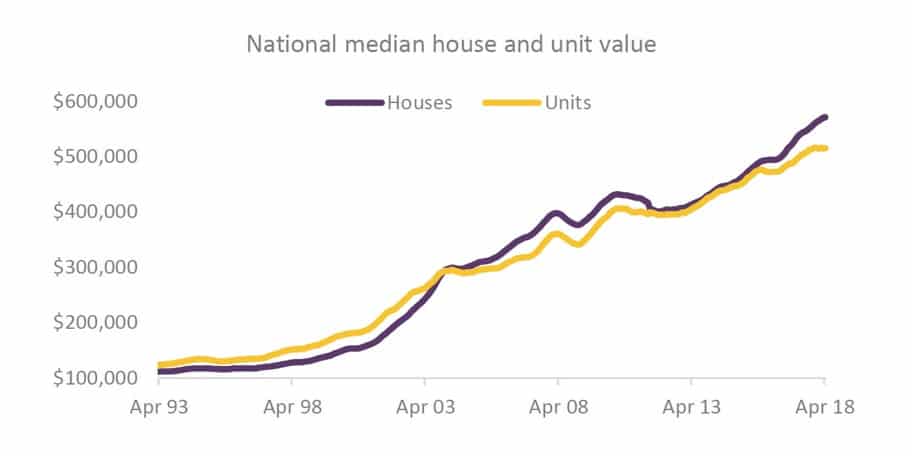
You can see there are peaks and throughs where prices rose and then experienced dips.
You can see the drop in 2008 during the Global Financial Crisis. You can see the recovery from that, before another correction at the start of this decade.
What this chart doesn’t show is the bulk of the softening of prices seen since late 2017, which really kicked off last year. But if it did, you would see a drop that’s a bit smaller than that valley in 2008.
But really, if you trace your finger over those two lines, it would move upwards steadily. That doesn’t really look like a bursting bubble to me.
All losses aren’t created equal
Another thing to note from talk about bubbles bursting is that market declines are not always universal. It’s the same for market growth. Just because prices are going up or down on a median measure across an entire capital city, it doesn’t mean every suburb is equal.

If you look at the suburbs in Sydney and Melbourne that have seen properties sell at a loss – that is, for less than they were last sold for – then you begin to see a picture emerge.
In Sydney, the suburbs that saw the highest percentage of losses in value between sales during the March quarter were Strathfield, Parramatta and Ryde, which experienced big increases from speculative buying and overheated auction markets, and Lane Cove and Canterbury-Bankstown, which experienced a big influx of supply of new dwellings in the lead-up to the correction.
In Melbourne, those biggest loss-making suburbs were the CBD, a unit oversupply hotspot and Stonnington, the north-western part of which was hit by oversupply issues and the north-eastern part of which experienced prestige demand drops.
So… supply and demand. The basic economic drivers of property prices. Again, that sounds like a standard market correction to me.
Ignore the hype, do your research
Markets go up and markets sometimes go down. If you look at that graph plotting 20 years’ worth of activity, you’ll see they don’t explode, pop, crash or collapse.
Property investors who buy well, based on solid research and good growth fundamentals and hold for the long-term are likely to not only weather the storms that do occur from time-to-time, but prosper during the sunny times.
The information provided in this article is general in nature and does not constitute personal financial advice. The information has been prepared without taking into account your personal objectives, financial situation or needs. Before acting on any information you should consider the appropriateness of the information with regard to your objectives, financial situation and needs.Andrew Mirams is the Founder and Managing Director of Intuitive Finance, a highly respected and multi-award winning Mortgage Brokerage dealing with clients all over Australia and around the world. Andrew has over 30 year’s experience in the finance industry and has assisted clients to secure over $2 Billion in mortgage lending over his time. Intuitive Finance deals with all aspects of lending from helping first homebuyers, someone wanting to upgrade their home or starting out and experienced investors looking to secure that next investment property, we can assist with all those requirements. We also specialise in working with self-employed clients and getting them the best outcomes, along with Commercial and Asset finance solutions. Intuitive Finance is highly regarded in the industry and has been recognised as a national winner of the MFAA customer service award and also one of the finance industry’s top mortgage employers. Our brokers also feature regularly in the Top 100 mortgage brokers list in Australia.